EDMUS 4 features: Using information
Graphs
Another way to display a summary of a patient file is to create a Graph.
A Graph displays an overview of the disease history, either for the whole disease duration, or for a 5 or 10 years period (you choose the start year).
You can view the Graph on-screen, print it, or save it as a JPEG file.
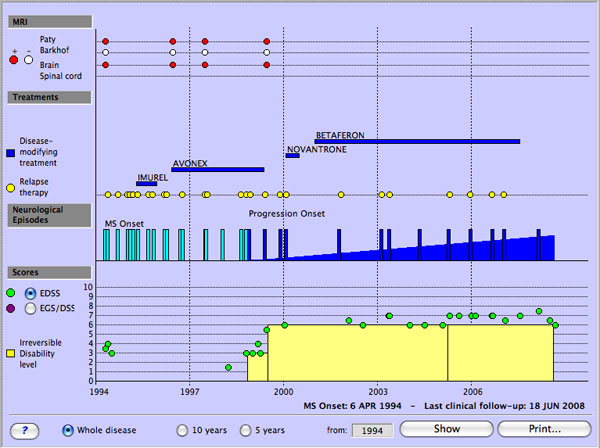
A sample Graph